Console UI
The Laminar Console UI provides a web-based interface for managing your streaming pipelines, connection tables, profiles, and system events.
Accessing the Console
The Console UI is available at http://localhost:3000 by default. Log in with your credentials to access the dashboard.
Dashboard
The Dashboard provides an overview of your Laminar deployment, including cluster status, resource counts, and quick access to key features.
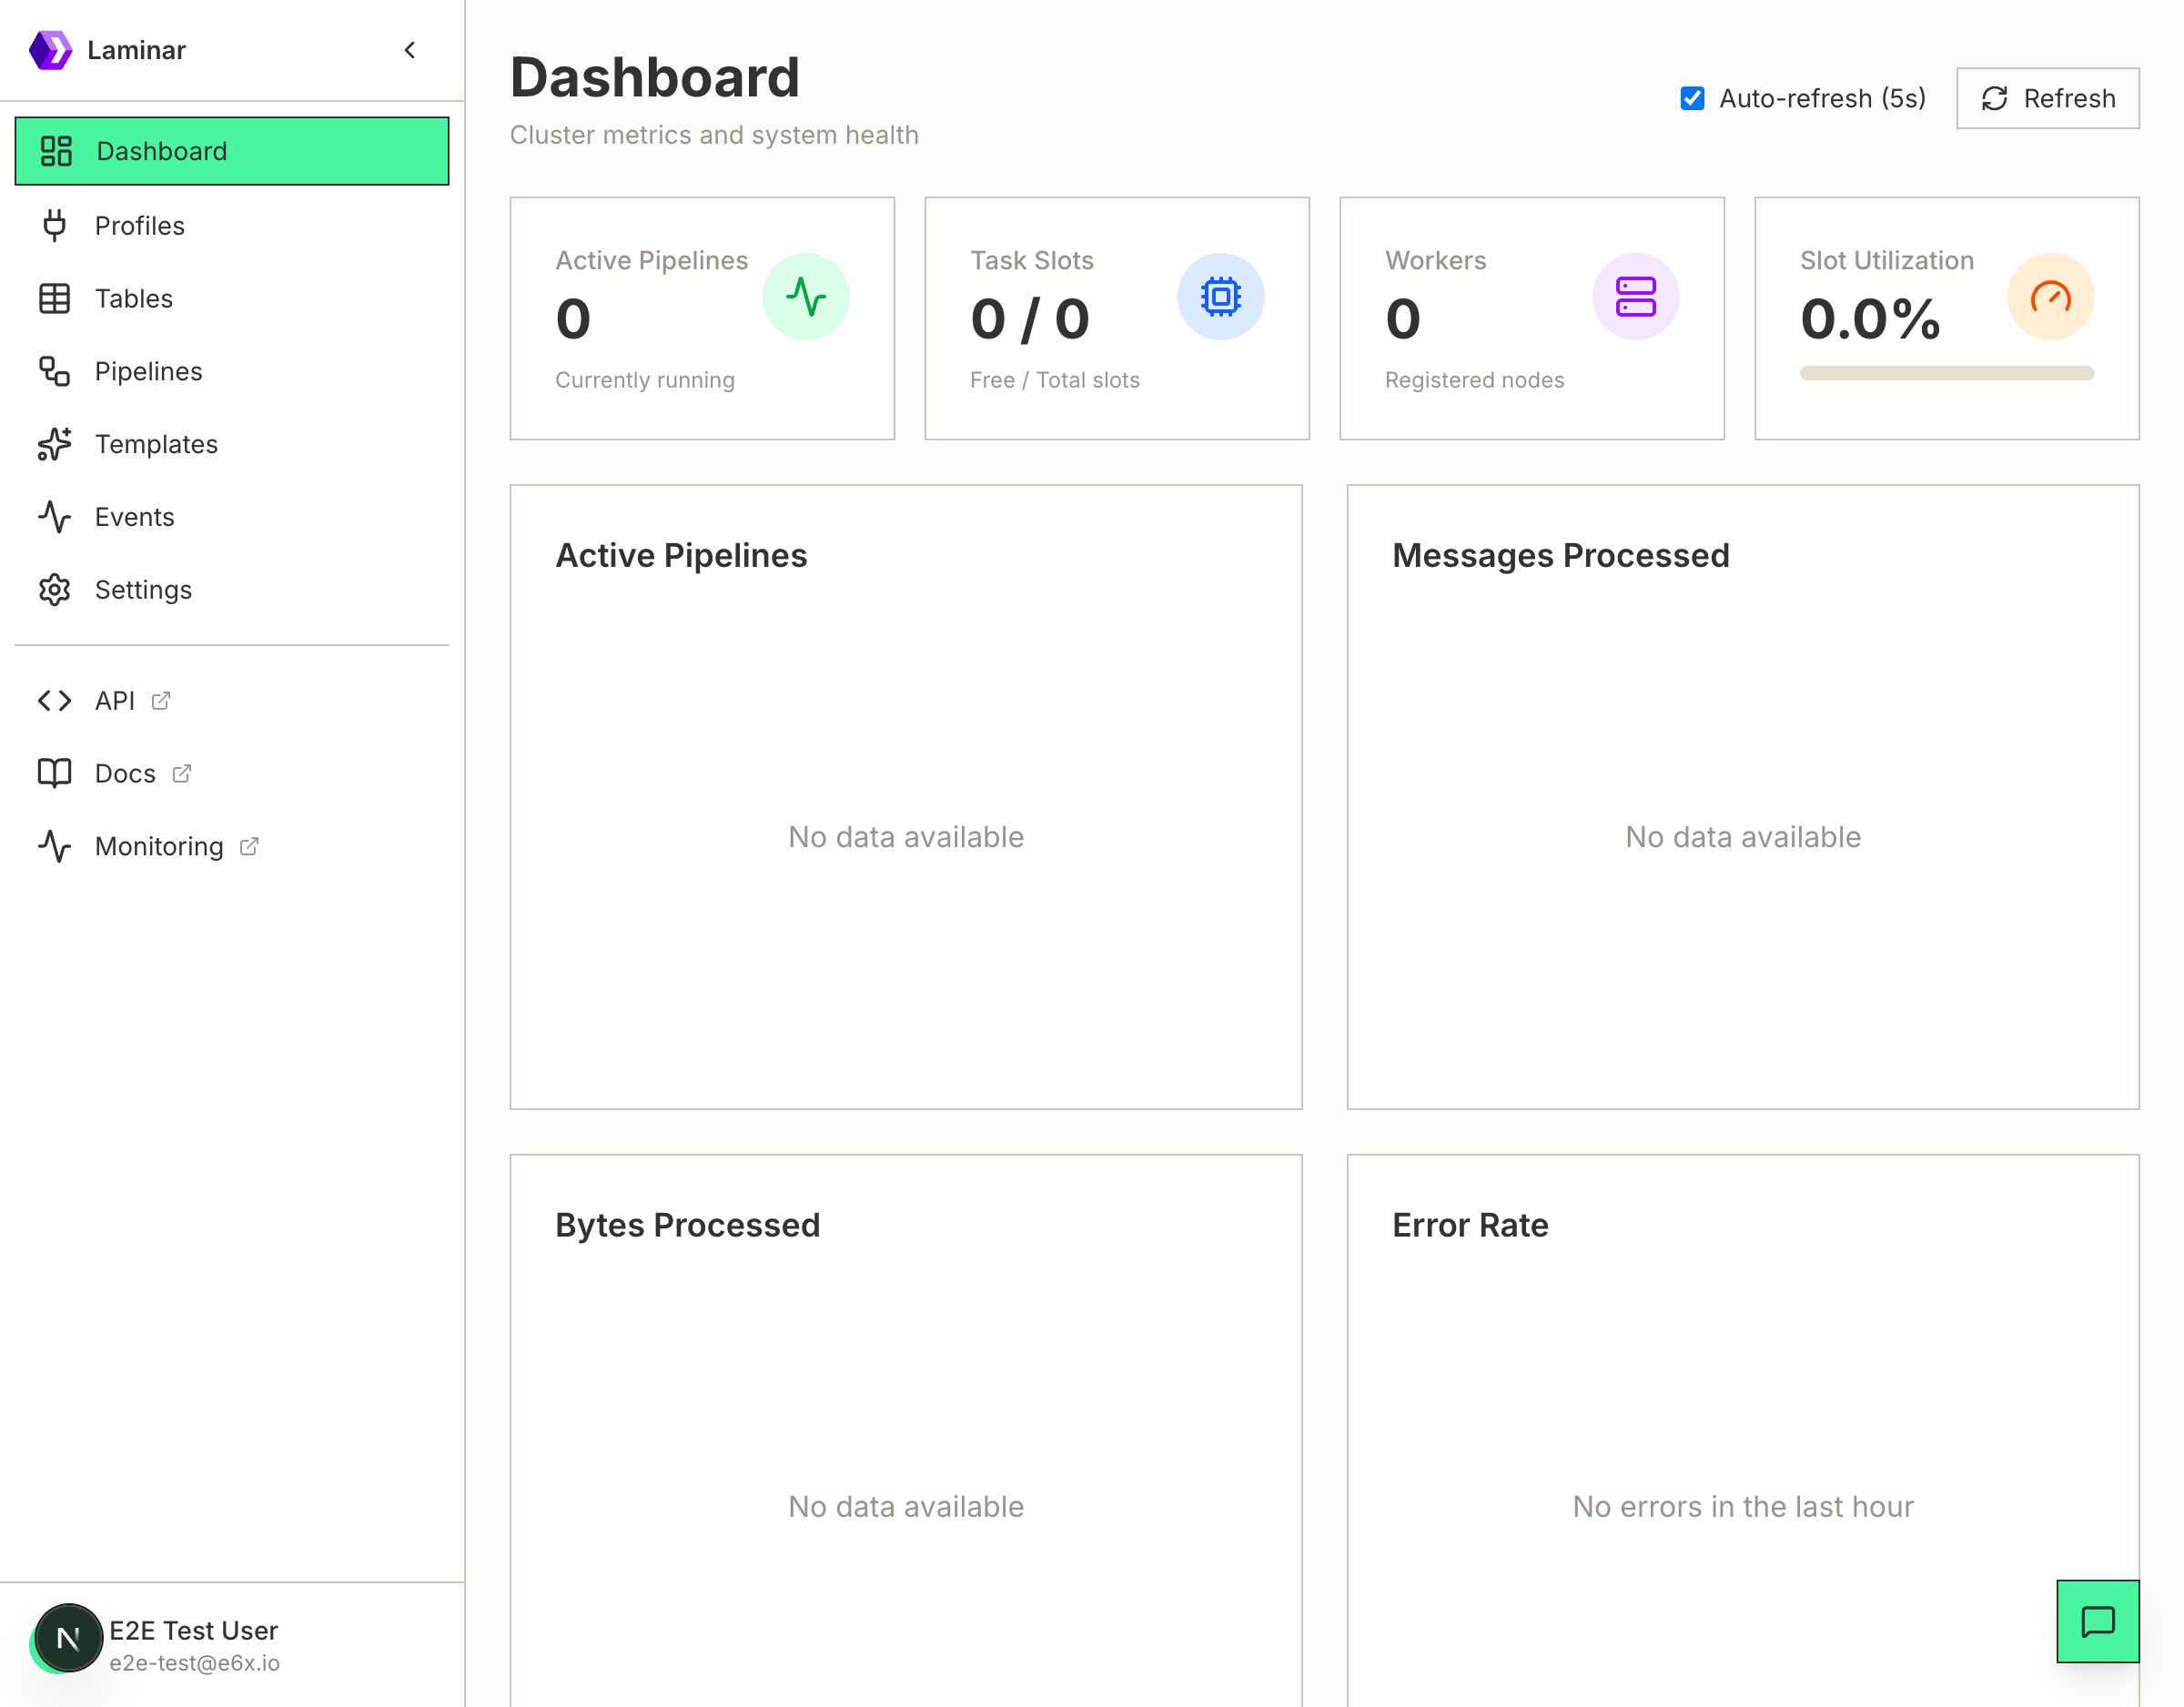
Dashboard Features
- Cluster Summary - View total counts of pipelines, tables, profiles, and running jobs
- Recent Activity - Quick access to recently created or modified resources
- System Health - Monitor overall system status and connectivity
Profiles
The Profiles page manages connection profiles, which define reusable connection configurations for external systems like Kafka, Iceberg, and other connectors.
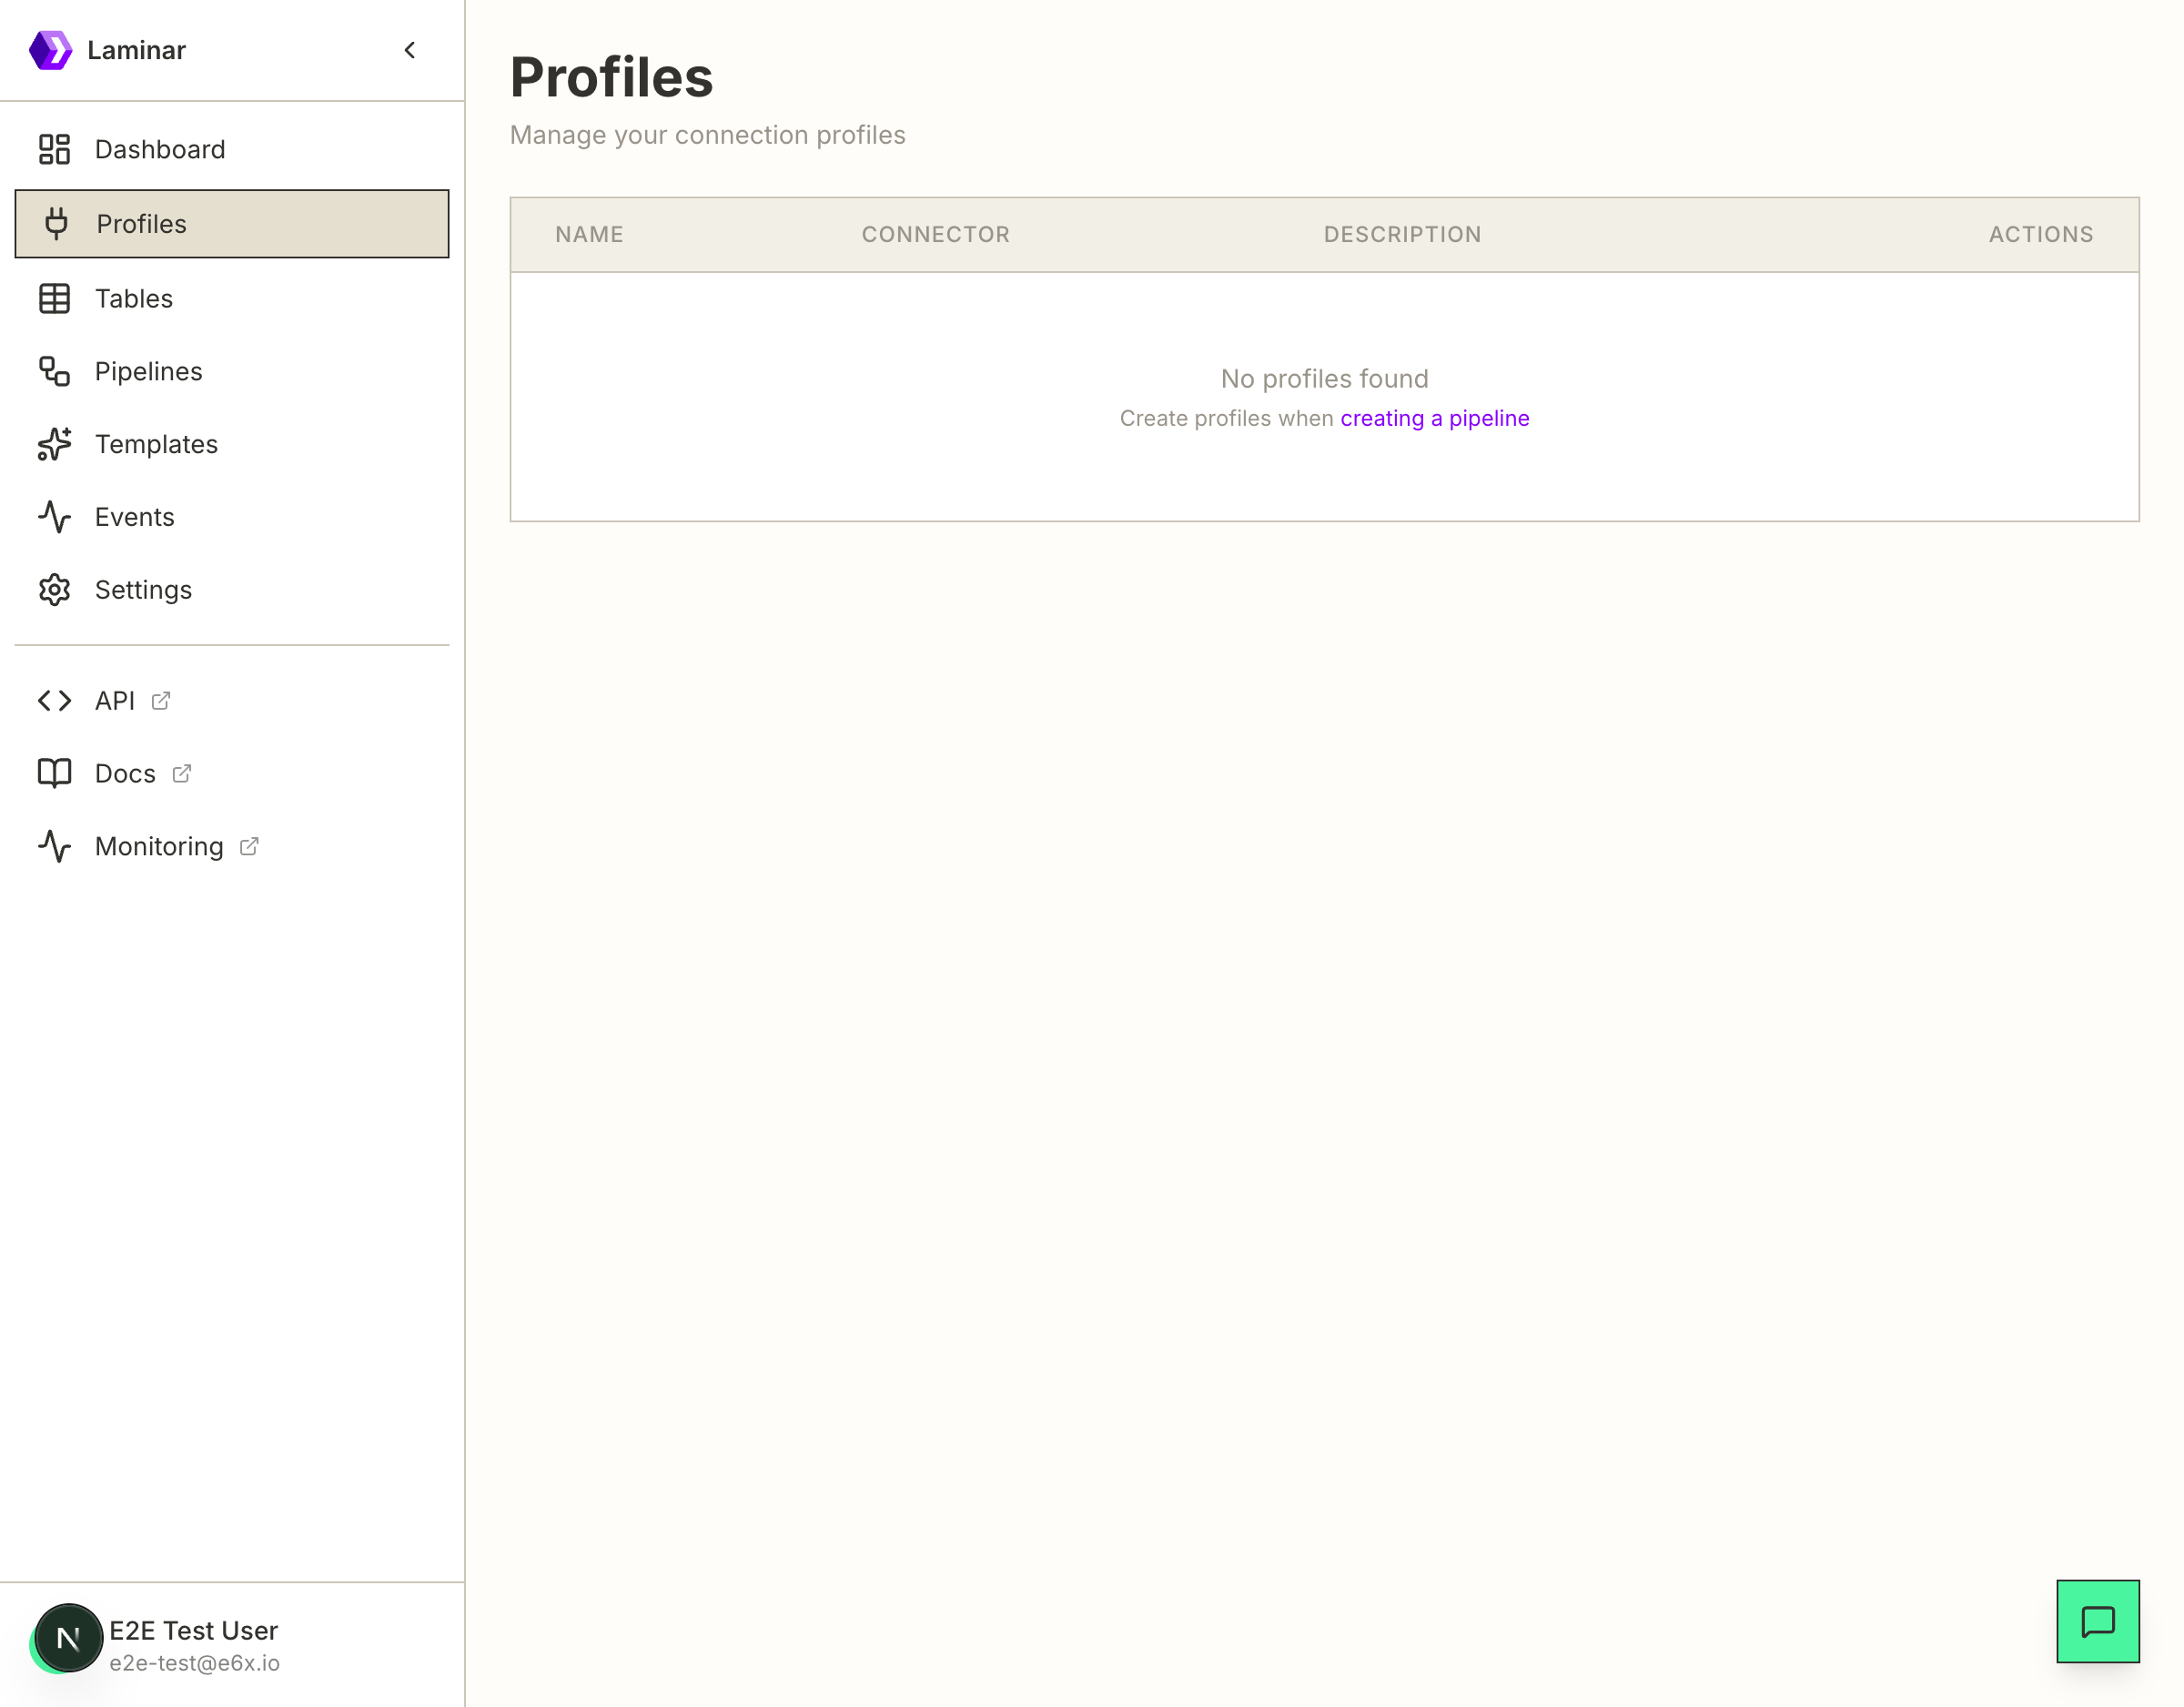
Profile Management
- Create Profile - Define new connection profiles with connector-specific configurations
- View Details - Inspect profile settings including authentication and connection parameters
- Delete Profile - Remove unused profiles (profiles in use by tables cannot be deleted)
Profile Information
| Column | Description |
|---|---|
| Name | Unique identifier for the profile |
| Connector | Type of connector (kafka, iceberg, etc.) |
| Created At | When the profile was created |
| Actions | Edit or delete the profile |
Tables
The Tables page manages connection tables, which represent data sources (inputs) and sinks (outputs) for your pipelines.
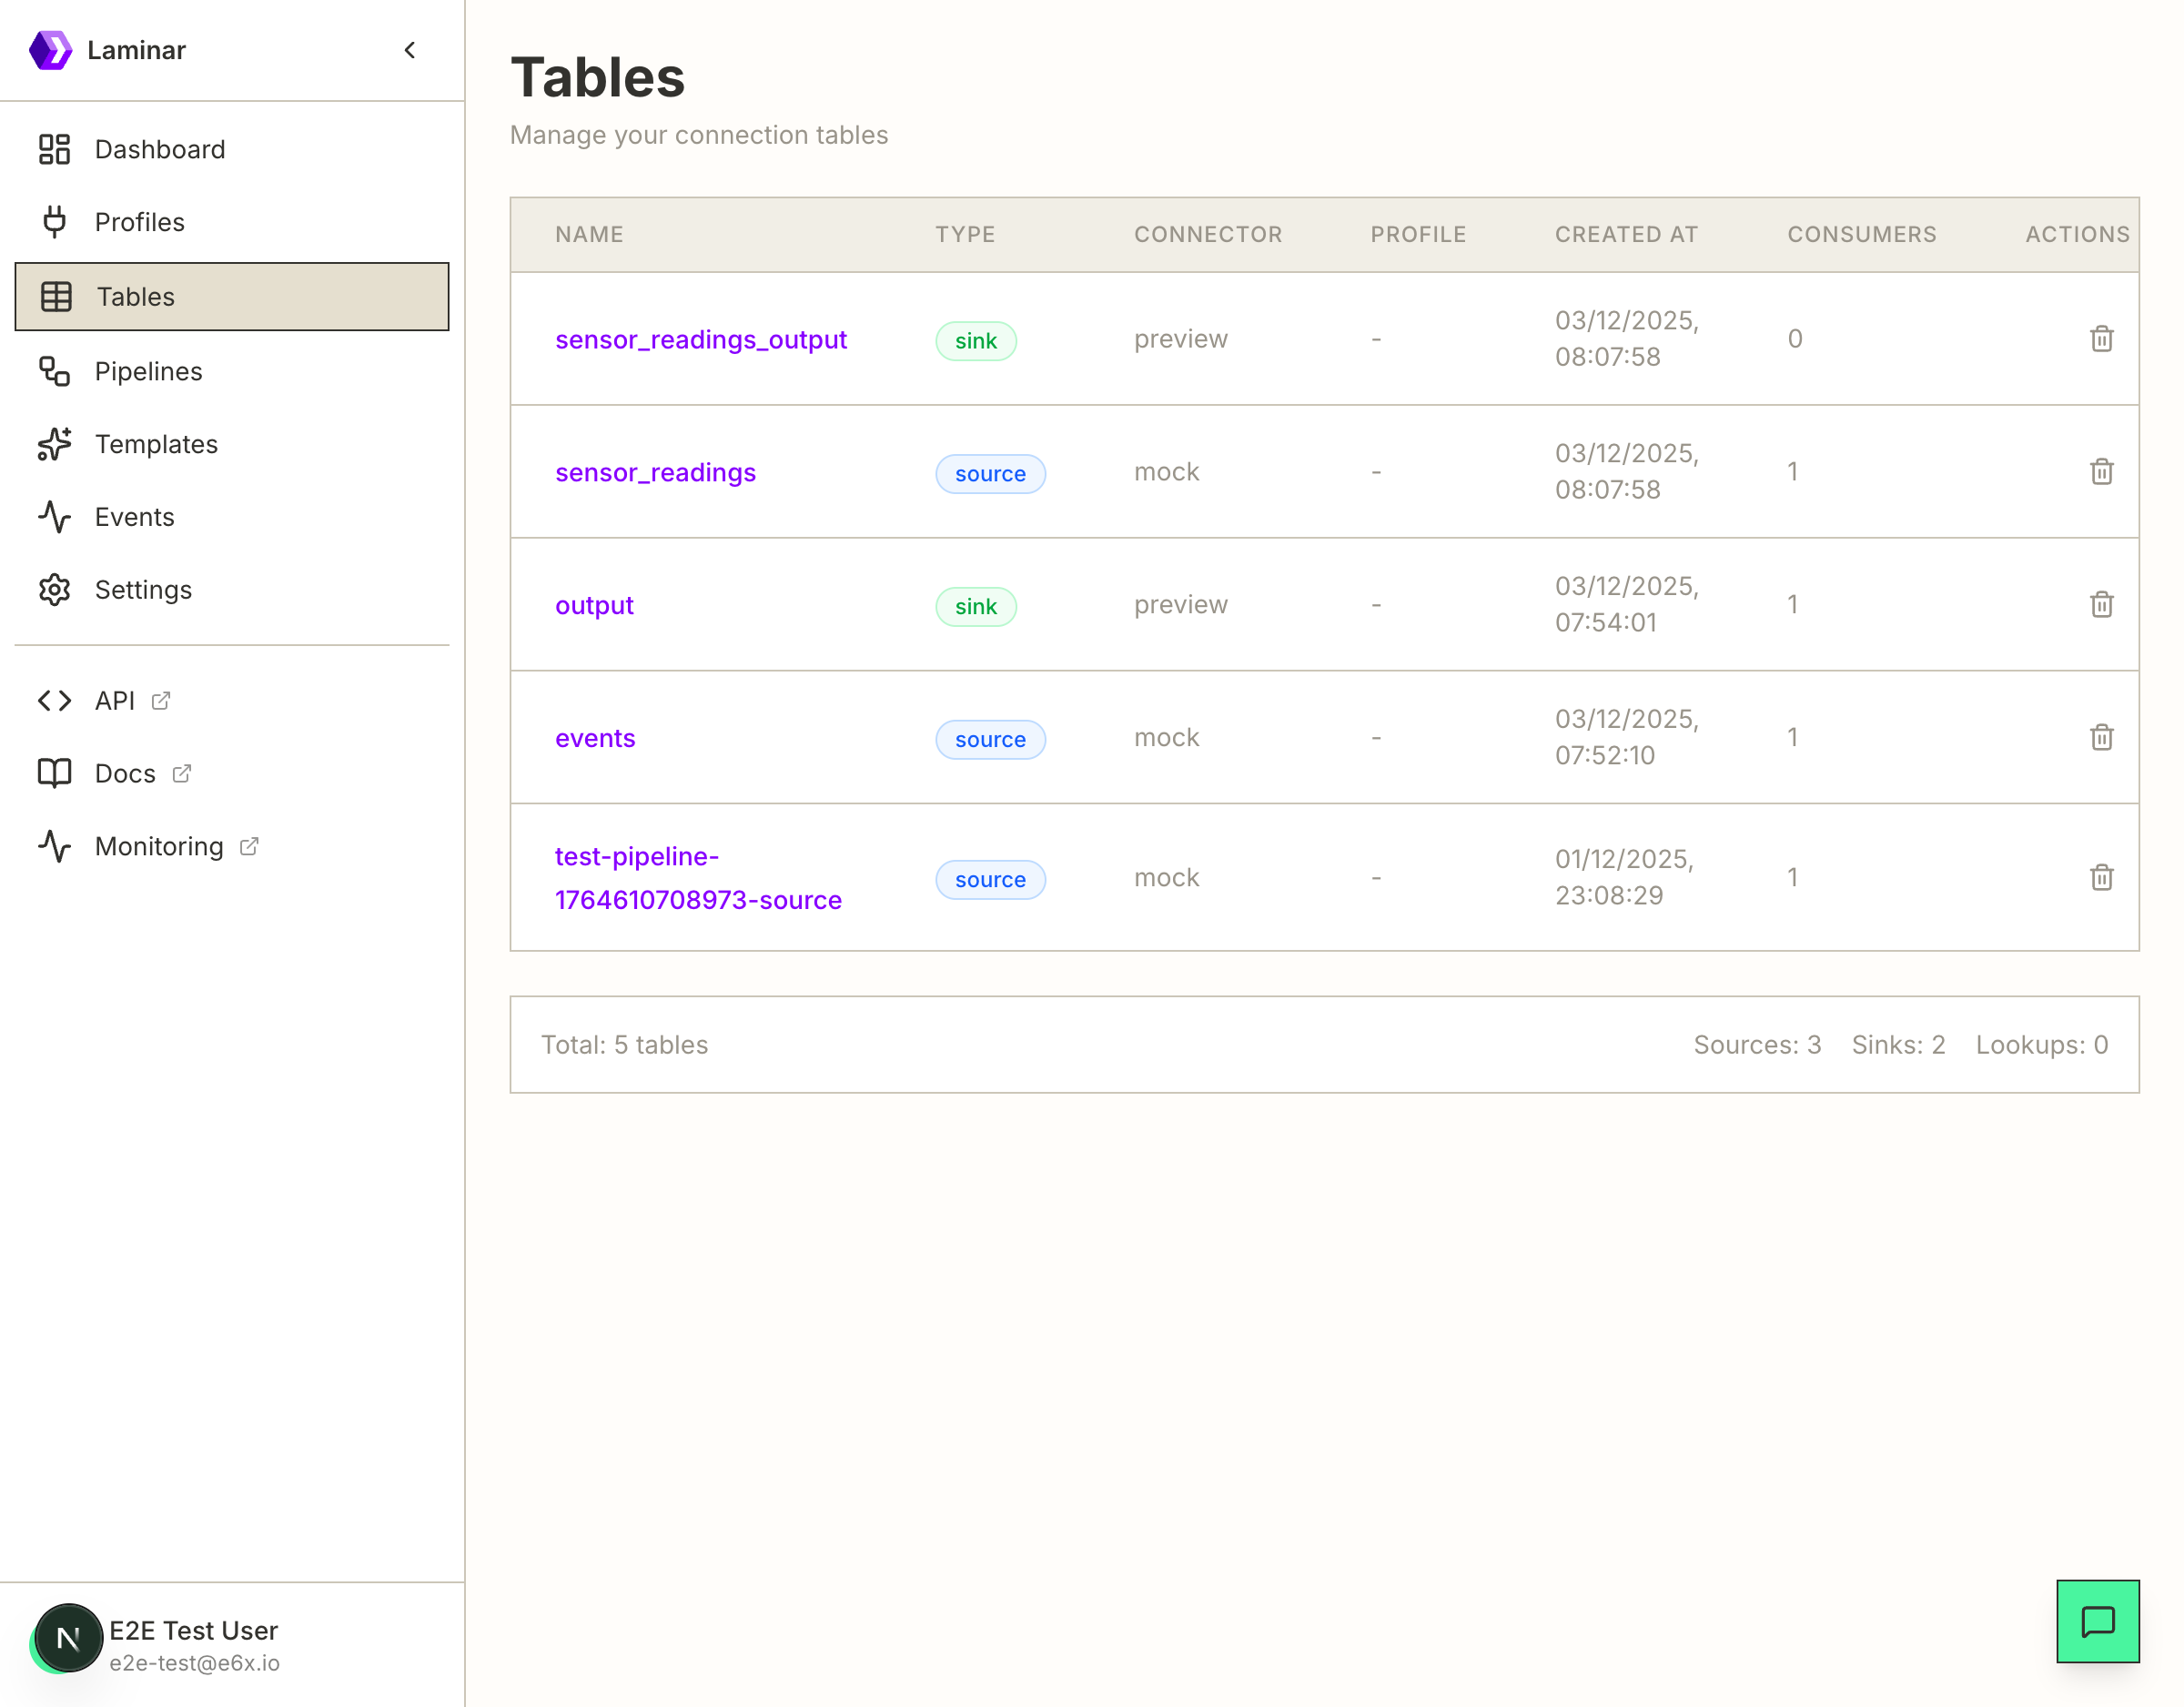
Table Types
- Source - Input tables that provide data to pipelines (e.g., Kafka topics, mock generators)
- Sink - Output tables that receive processed data (e.g., Iceberg tables, preview sinks)
- Lookup - Reference tables for enrichment joins
Table Information
| Column | Description |
|---|---|
| Name | Table name used in SQL queries |
| Type | Source, sink, or lookup |
| Connector | Connector type (kafka, iceberg, mock, preview, etc.) |
| Profile | Associated connection profile (if any) |
| Created At | When the table was created |
| Consumers | Number of pipelines using this table |
| Actions | Delete the table |
Pipelines
The Pipelines page is the central hub for managing your data processing pipelines.
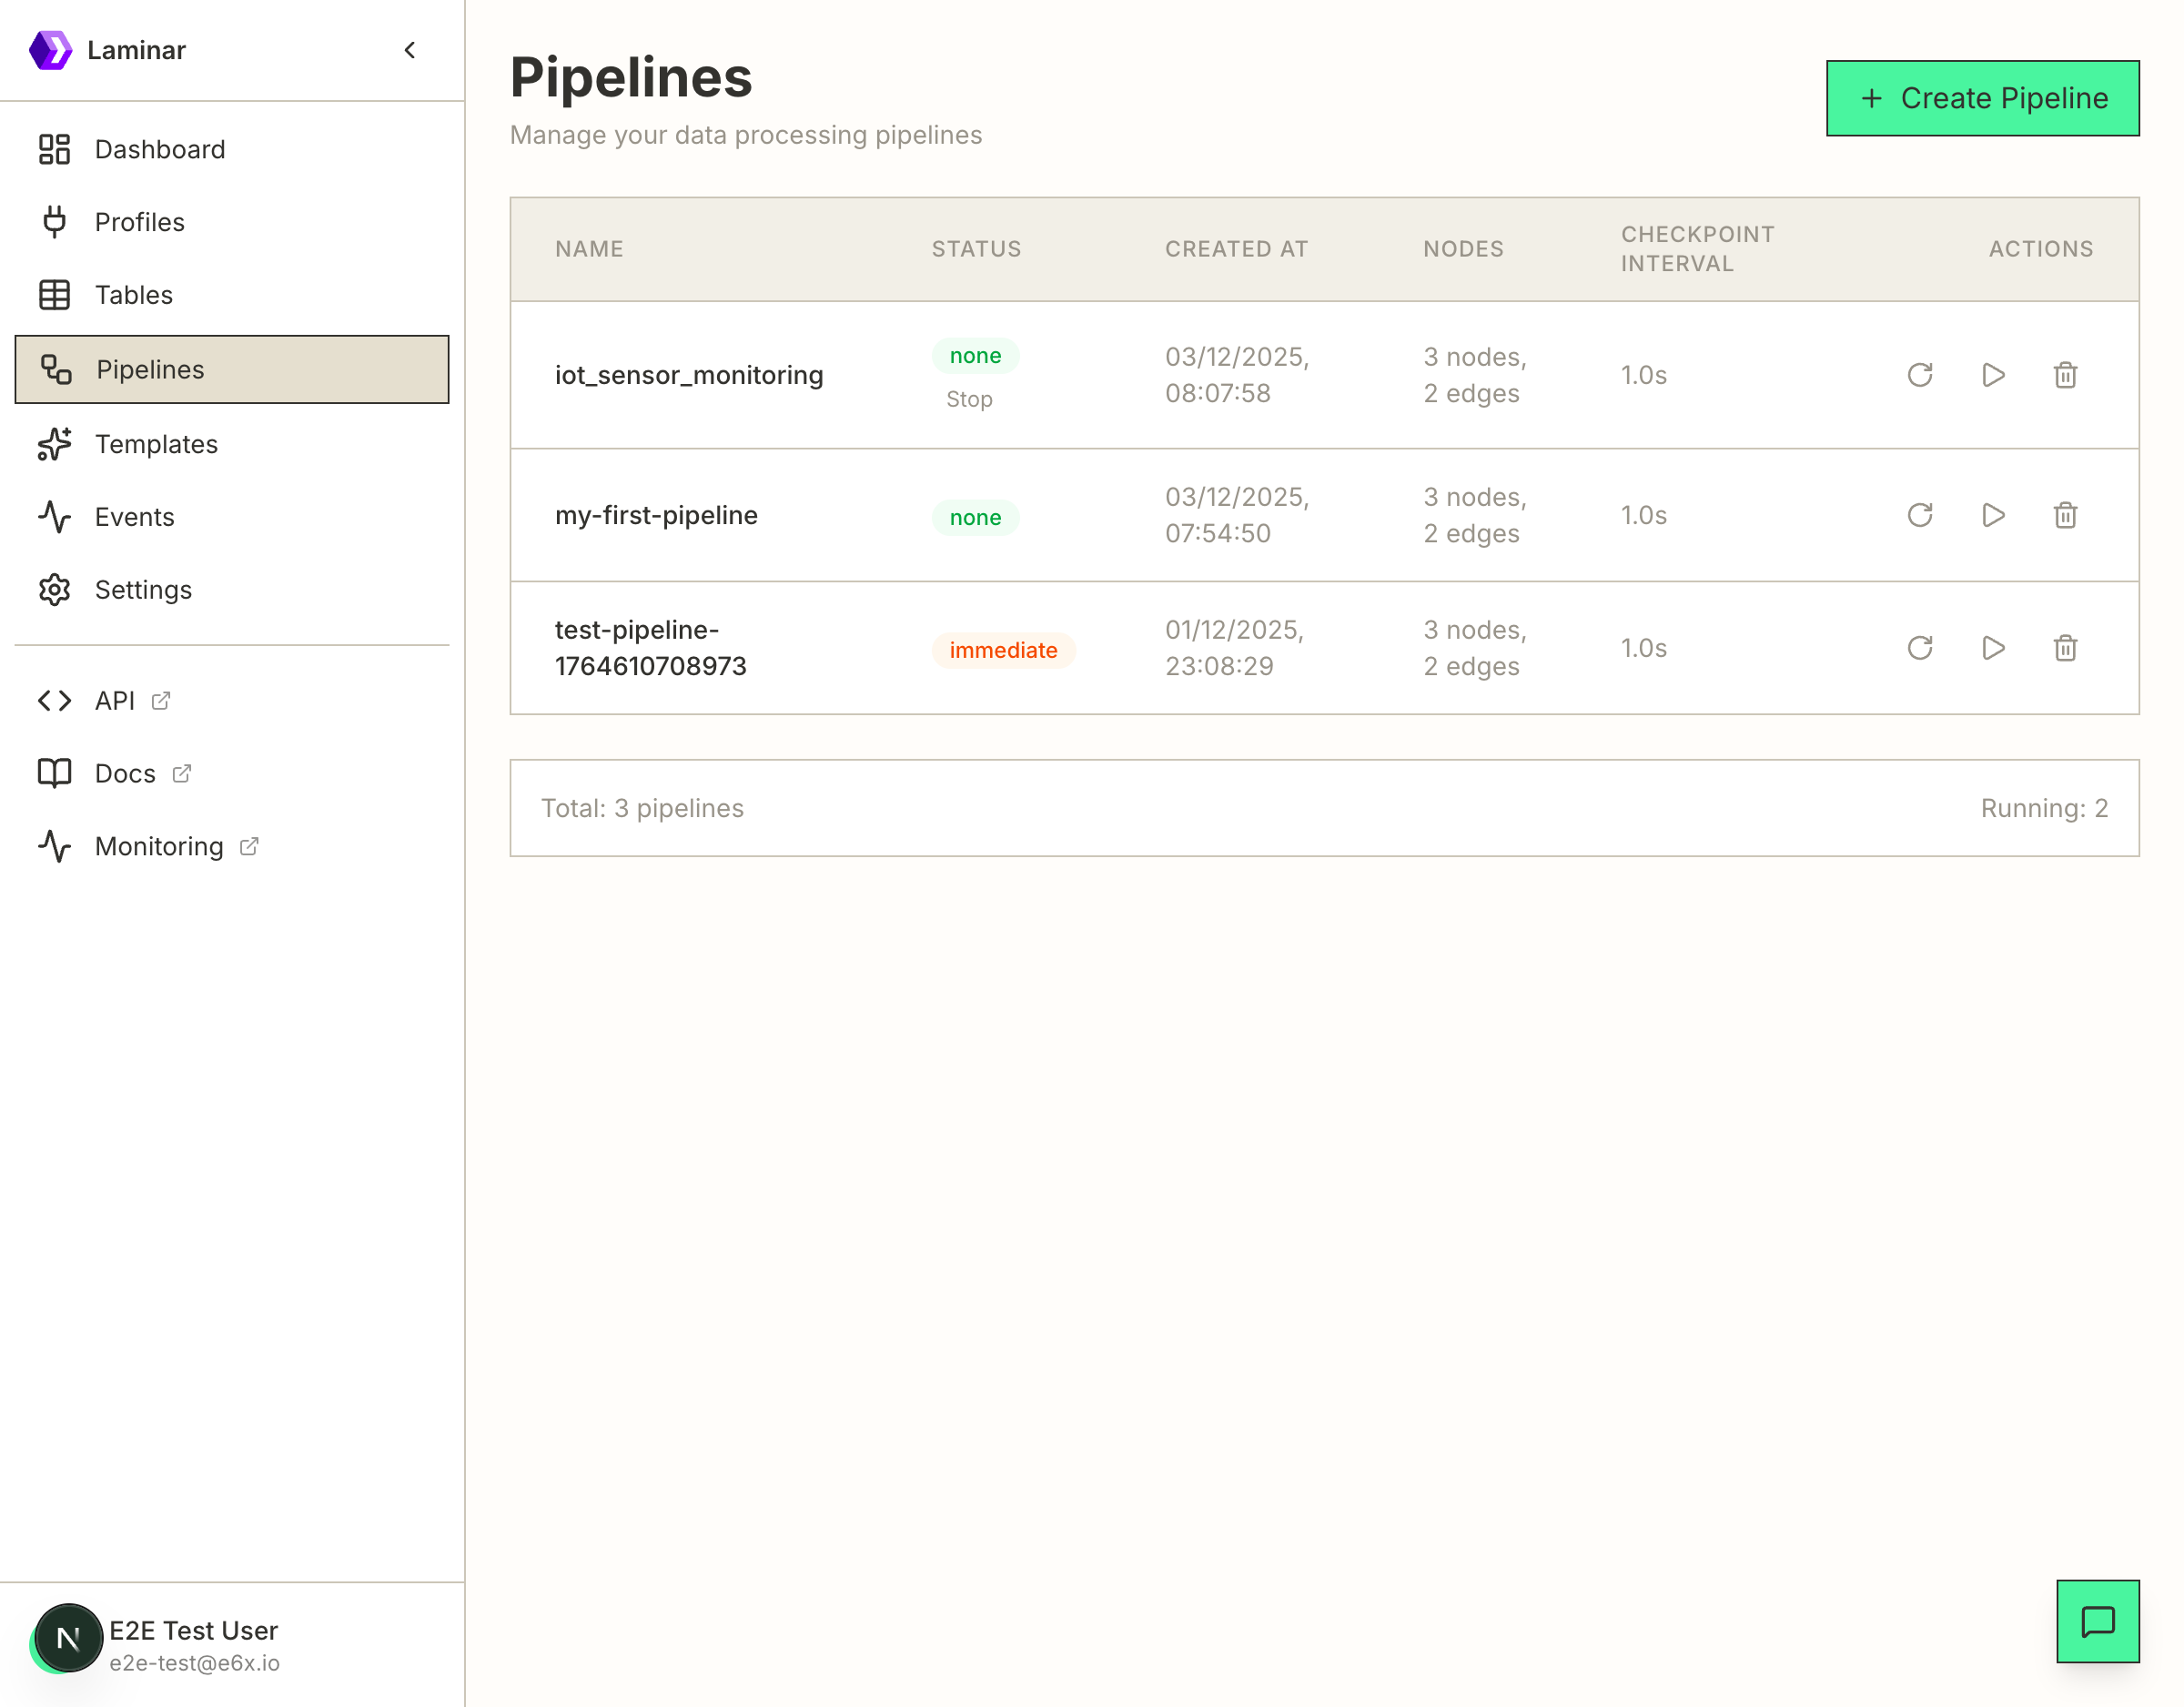
Pipeline Management
- Create Pipeline - Define new pipelines with SQL queries and configurations
- Start/Stop - Control pipeline execution
- View Details - Inspect pipeline configuration, jobs, and output
- Restart - Restart a pipeline from its last checkpoint
- Delete - Remove a pipeline and its associated jobs
Pipeline Information
| Column | Description |
|---|---|
| Name | Pipeline identifier |
| Status | Current state (none, checkpoint, immediate) |
| Created At | When the pipeline was created |
| Nodes | Number of operators and edges in the execution graph |
| Checkpoint Interval | How often state is checkpointed |
| Actions | Restart, view details, or delete |
Pipeline Status
- none - Pipeline is not running
- checkpoint - Pipeline is running with checkpointing enabled
- immediate - Pipeline is running in immediate mode
Templates
The Templates page provides quick-start configurations for common streaming use cases.
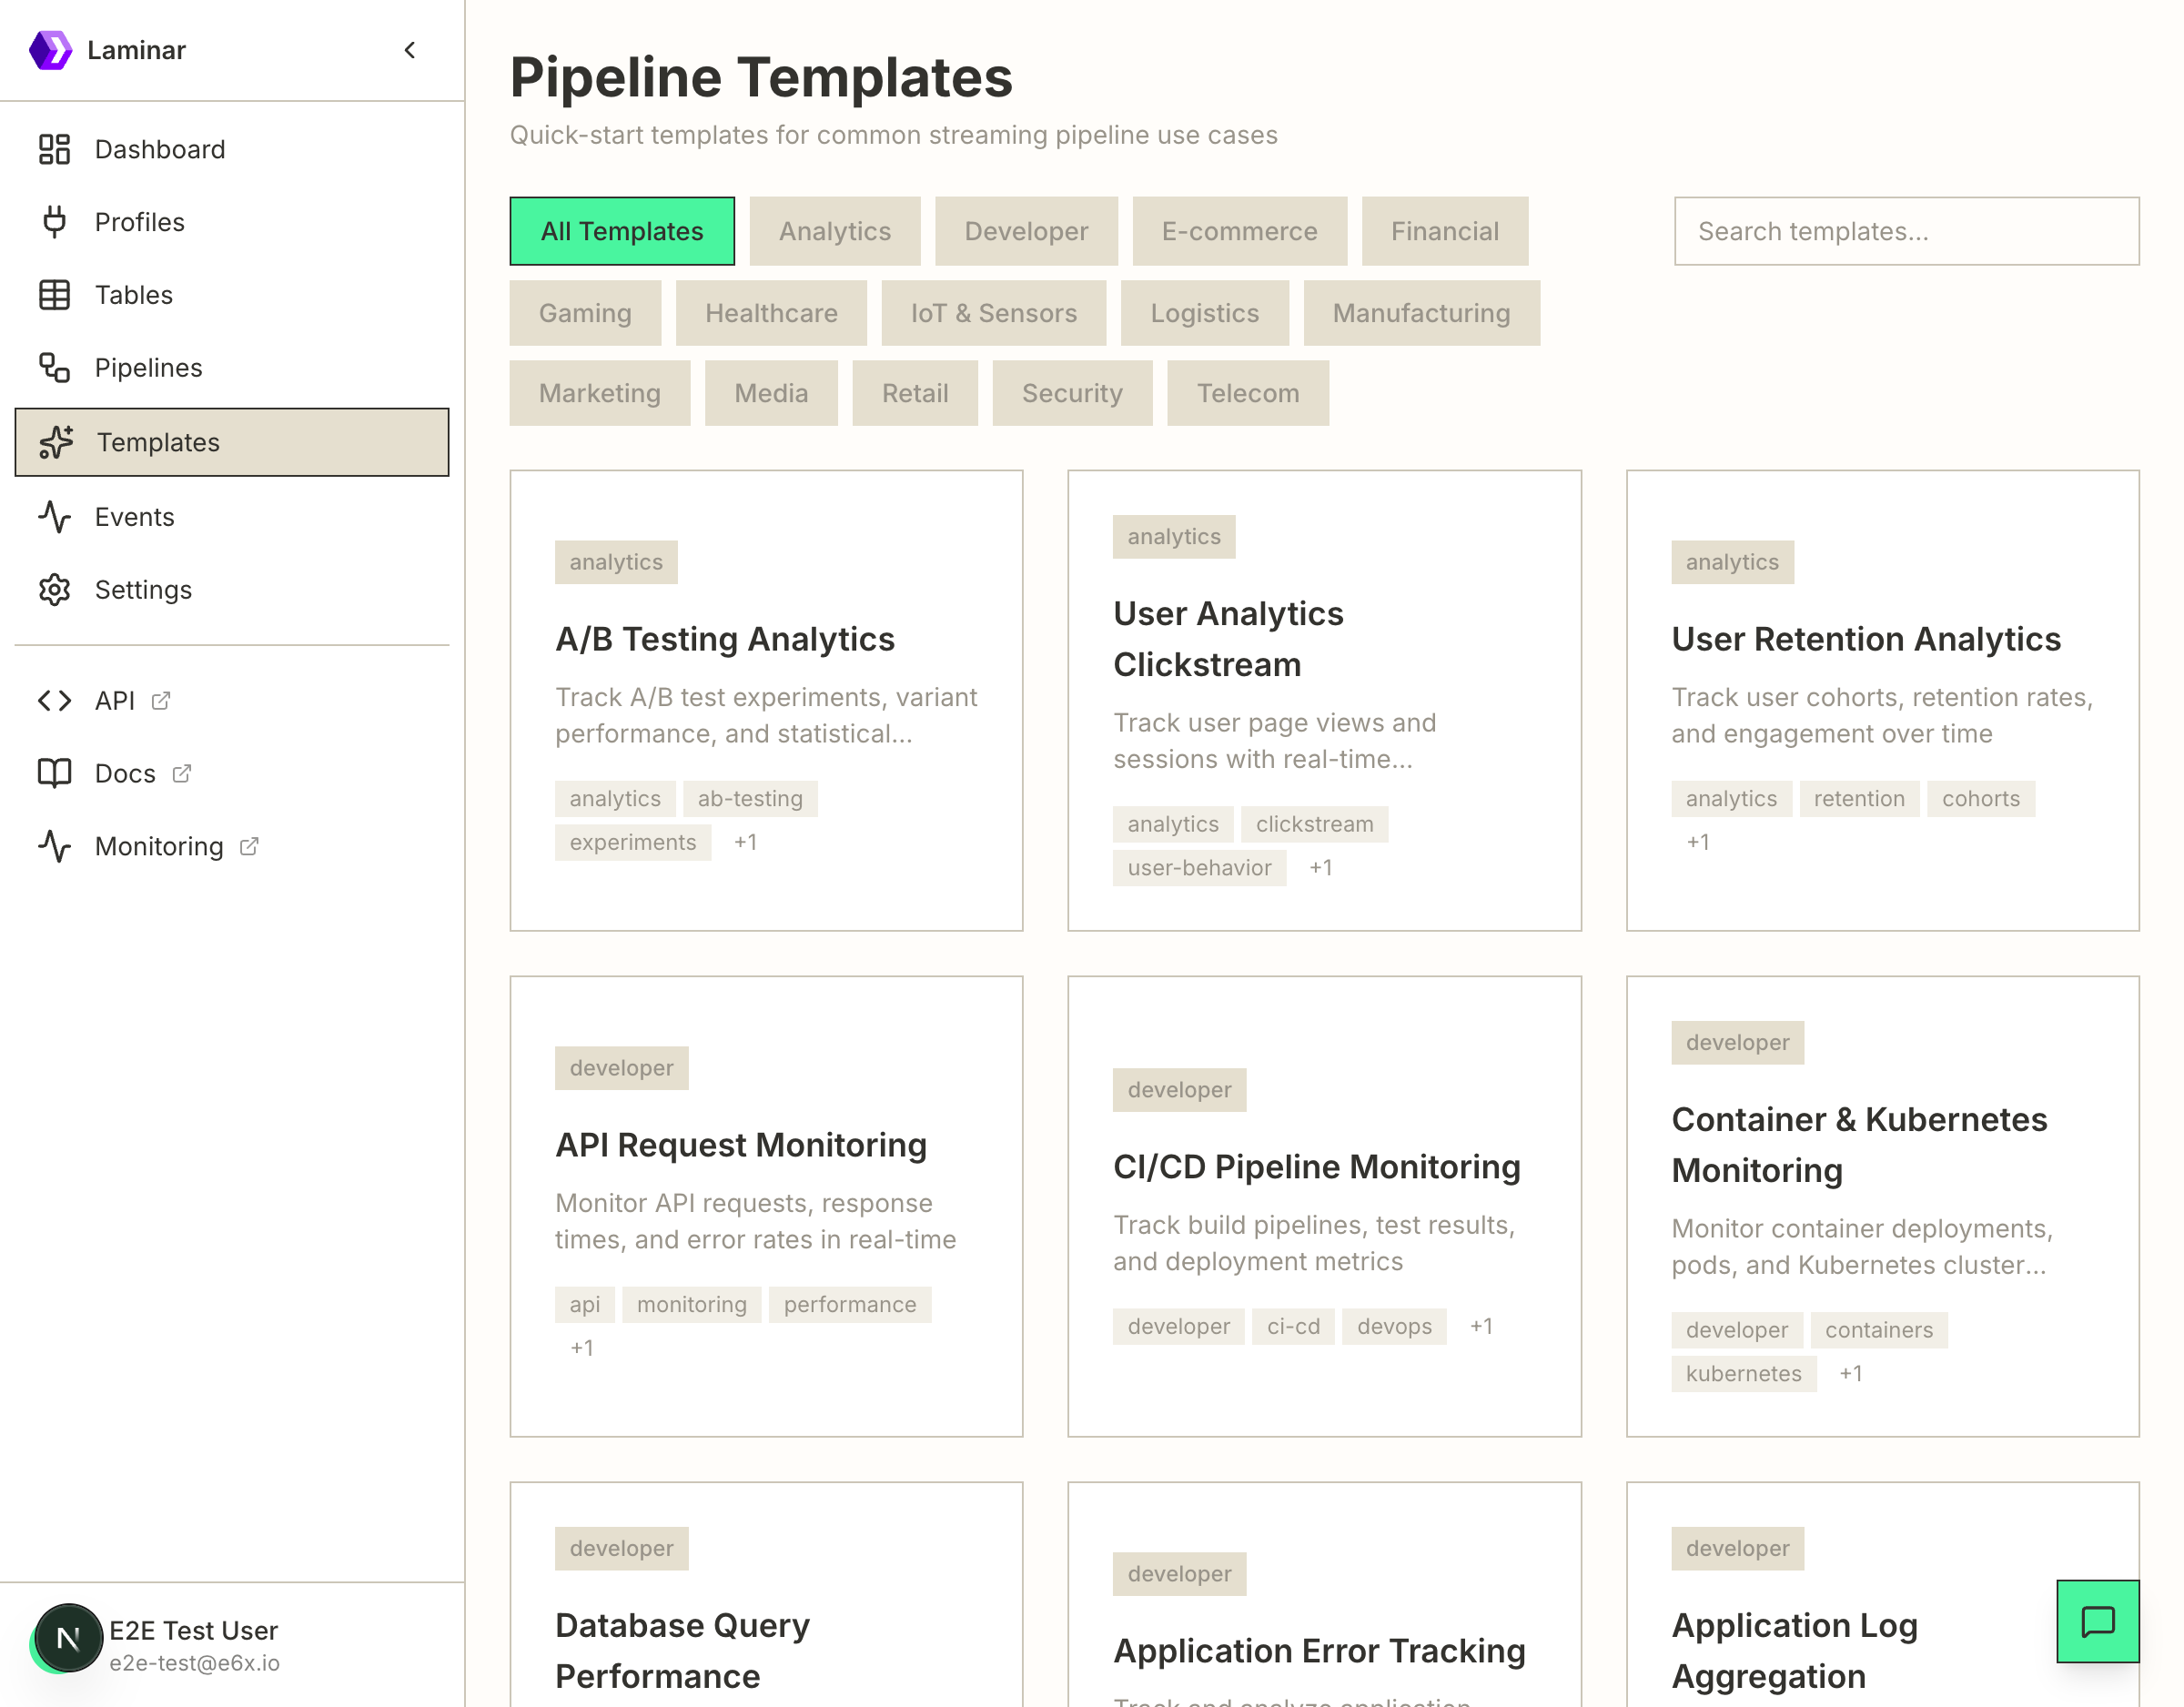
Template Categories
Templates are organized by industry and use case:
- Analytics - A/B testing, user analytics, retention tracking
- Developer - API monitoring, CI/CD pipelines, error tracking, log aggregation
- E-commerce - Cart abandonment, order processing, recommendations
- Financial - Fraud detection, transaction monitoring
- Gaming - Player tracking, leaderboards, matchmaking
- Healthcare - Patient monitoring, appointments, medication tracking
- IoT & Sensors - Device monitoring, sensor data processing
- Logistics - Fleet management, shipment tracking, warehouse operations
- Manufacturing - Production monitoring, equipment maintenance
- Marketing - Campaign analytics, customer segmentation
- Media - Content streaming, ad impressions, social engagement
- Retail - POS transactions, inventory management, loyalty programs
- Security - Access control, intrusion detection, vulnerability scanning
- Telecom - CDR processing, network monitoring
Using Templates
- Browse or search for a template
- Click on a template to view its details
- Click "Use Template" to start the pipeline creation wizard
- Customize the configuration as needed
- Create the pipeline
For detailed instructions, see the Templates Guide.
Events
The Events page displays system events from Laminar, including job lifecycle events, state transitions, and errors.
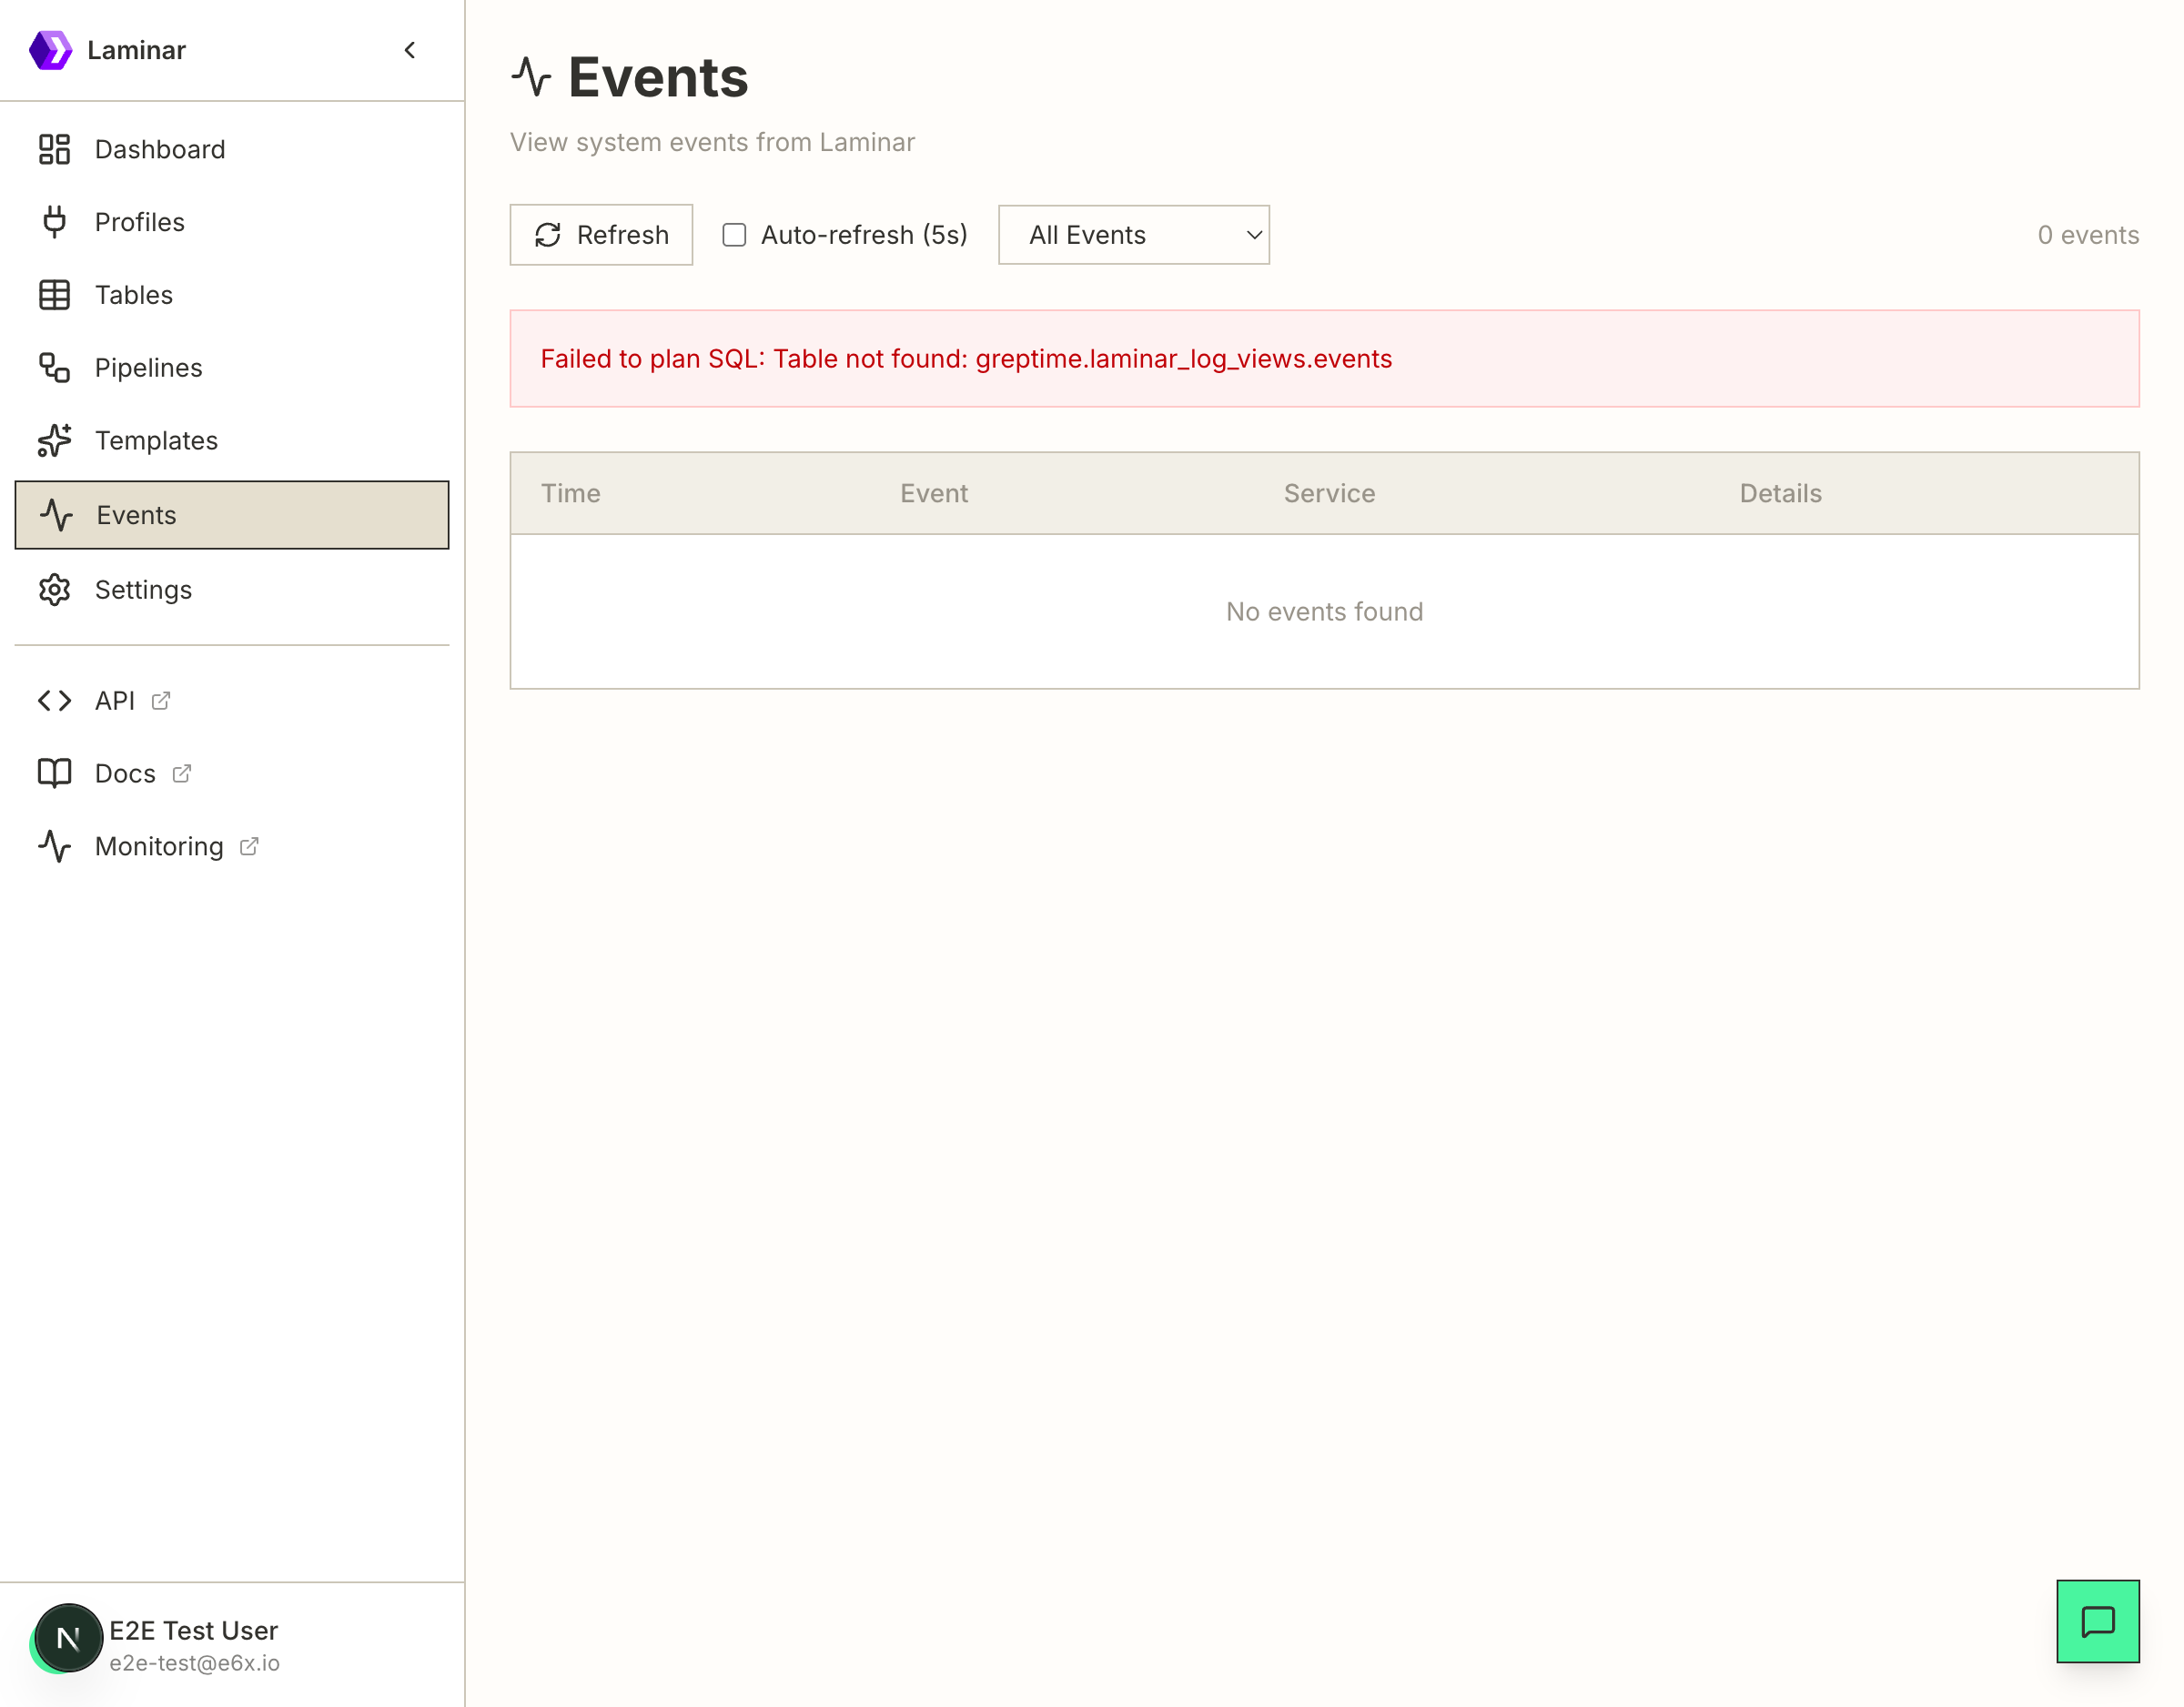
Event Filtering
- All Events - Show all system events
- Job Created - New job creation events
- State Transition - Pipeline state changes
- State Error - Recoverable state errors
- Fatal Error - Unrecoverable errors
- API Error - API-related errors
Event Controls
- Refresh - Manually refresh the event list
- Auto-refresh - Enable automatic refresh every 5 seconds
- Event Filter - Filter by event type
Event Information
| Column | Description |
|---|---|
| Time | When the event occurred |
| Event | Type of event |
| Service | Which service generated the event |
| Details | Event-specific information |
Settings
The Settings page displays the current server configuration.
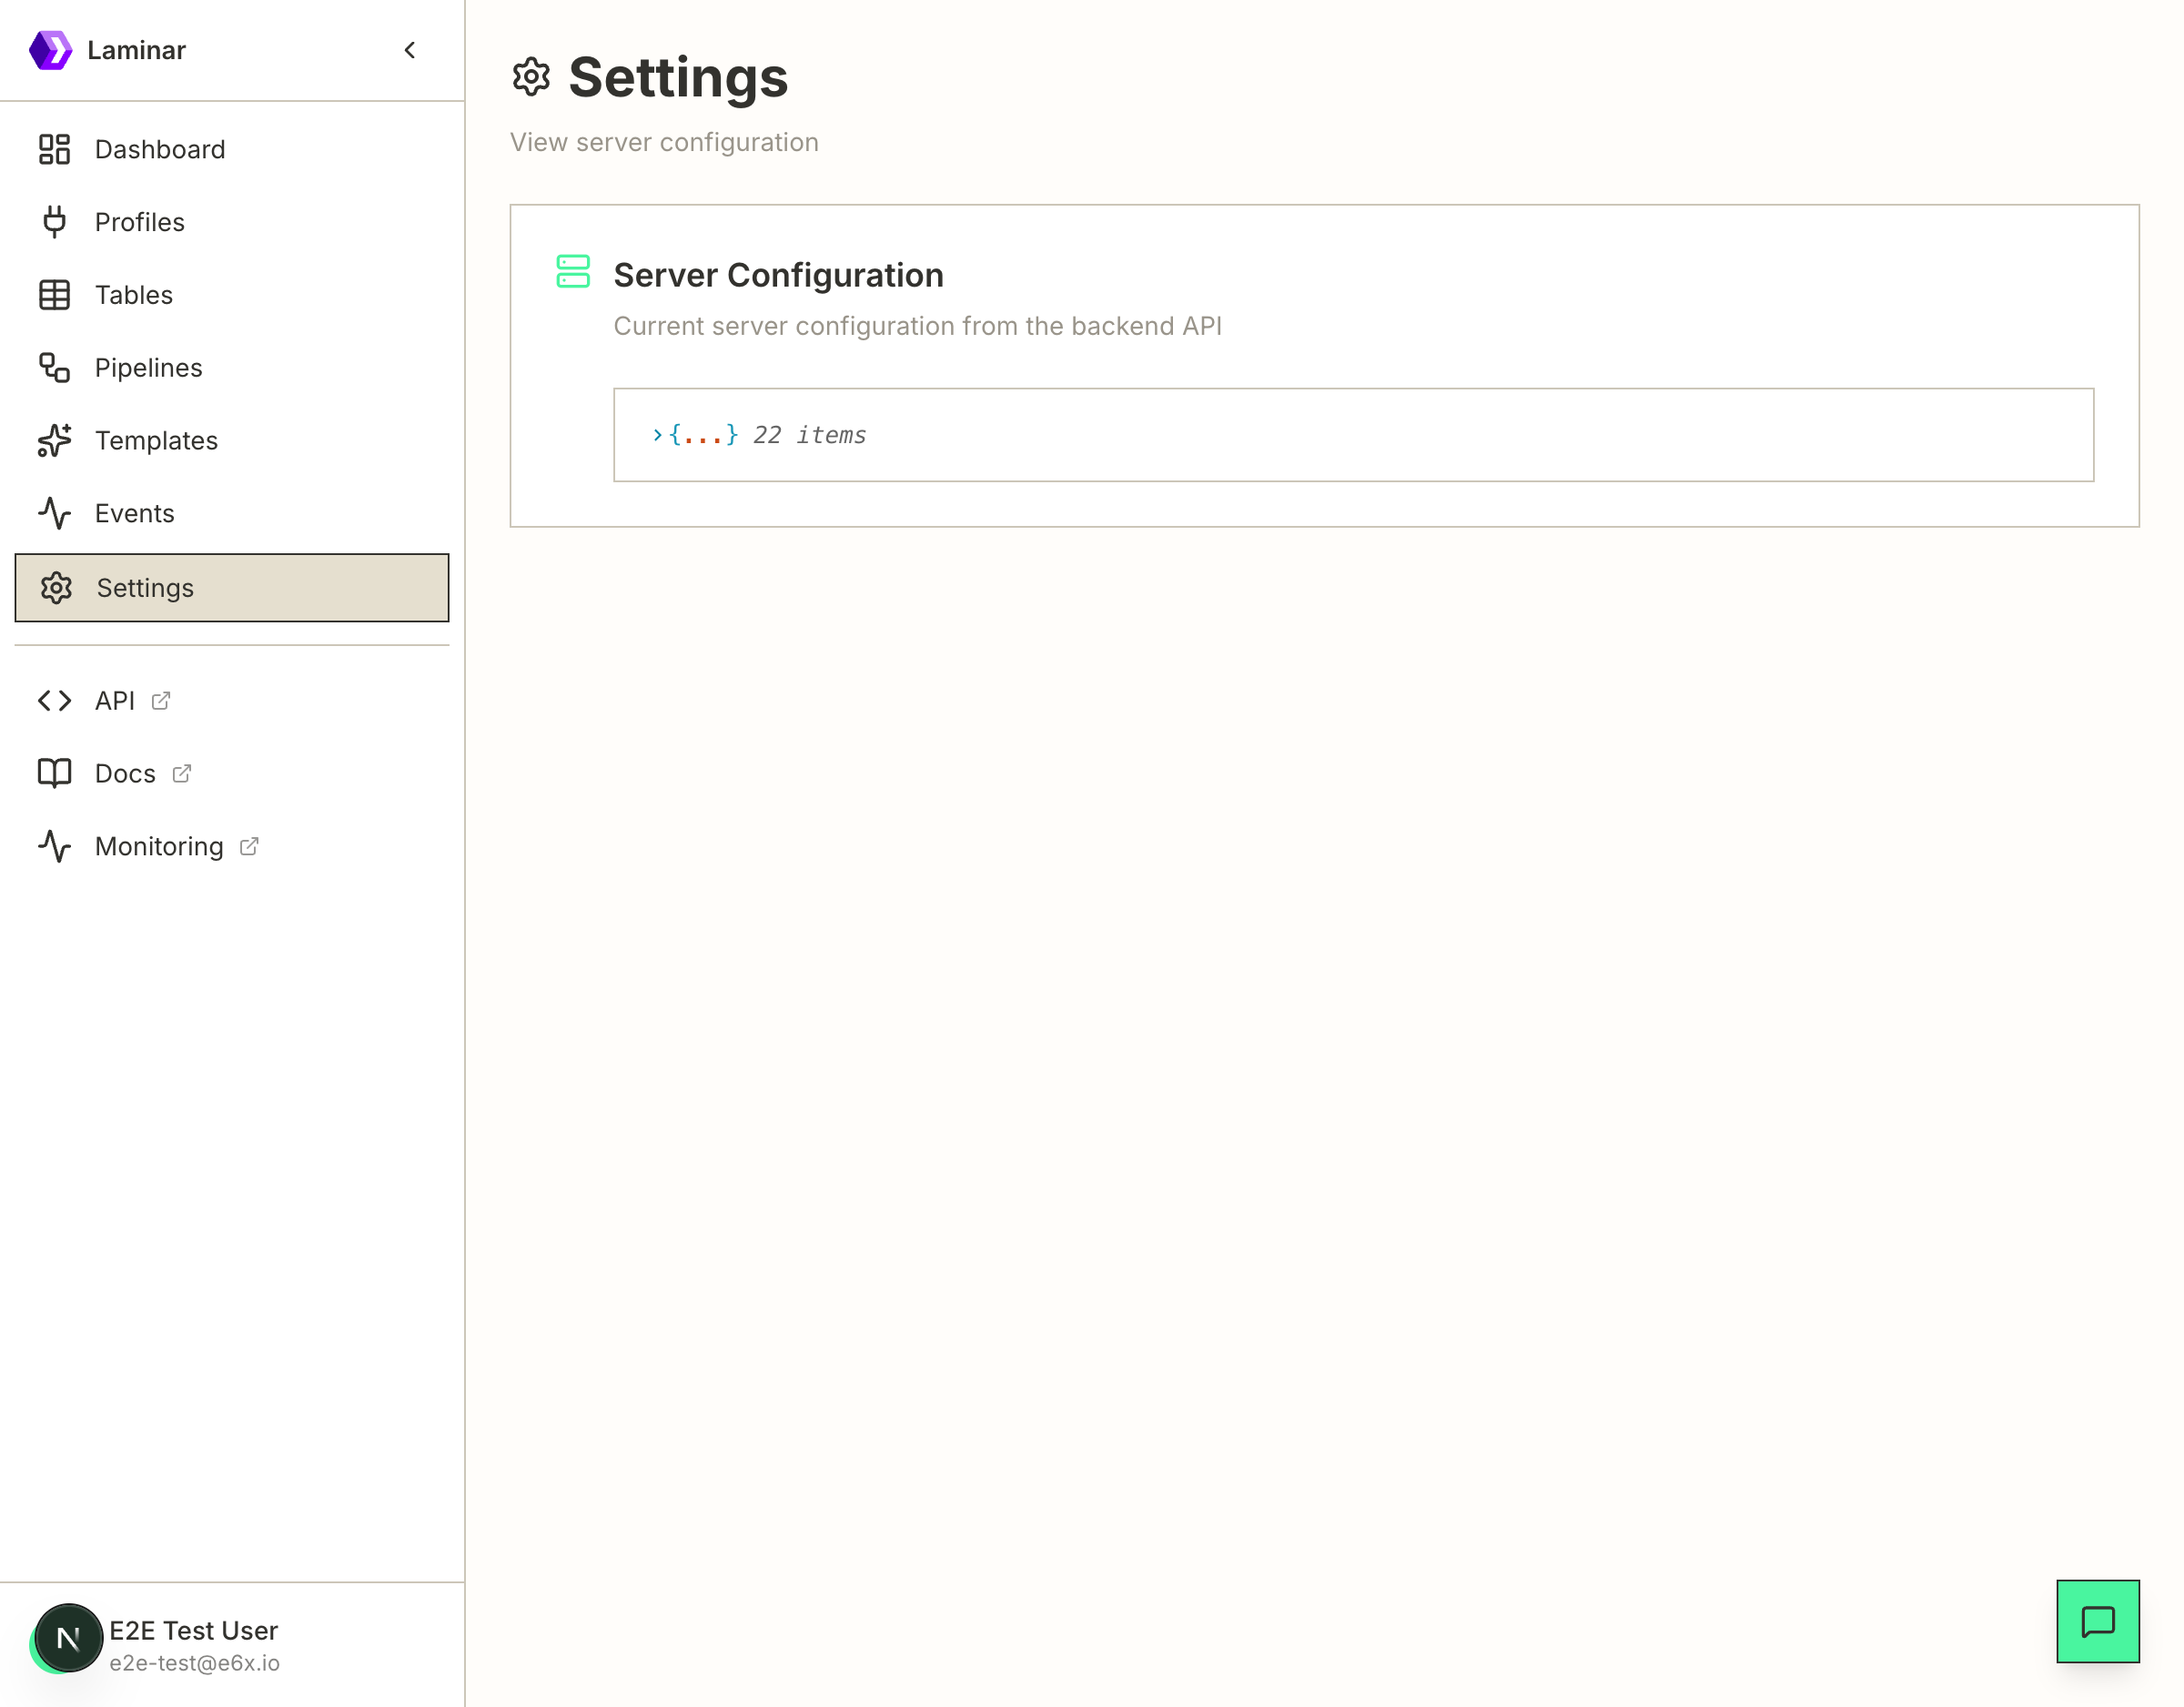
Server Configuration
View the current backend configuration including:
- API endpoints and ports
- Database connections
- Feature flags
- Runtime settings
The configuration is displayed as a JSON object that can be expanded to view all settings.
Navigation
The sidebar provides quick access to all sections:
| Section | Description |
|---|---|
| Dashboard | System overview and summary |
| Profiles | Connection profile management |
| Tables | Source, sink, and lookup tables |
| Pipelines | Pipeline management |
| Templates | Quick-start pipeline templates |
| Events | System event log |
| Settings | Server configuration |
| API | OpenAPI documentation (external) |
| Docs | Documentation (external) |
| Monitoring | Grafana dashboards (external) |
Next Steps
- Quick Start - Create your first pipeline
- Templates - Use templates to get started quickly
- API Reference - Programmatic access to Laminar
- LMNR CLI - Command-line interface